
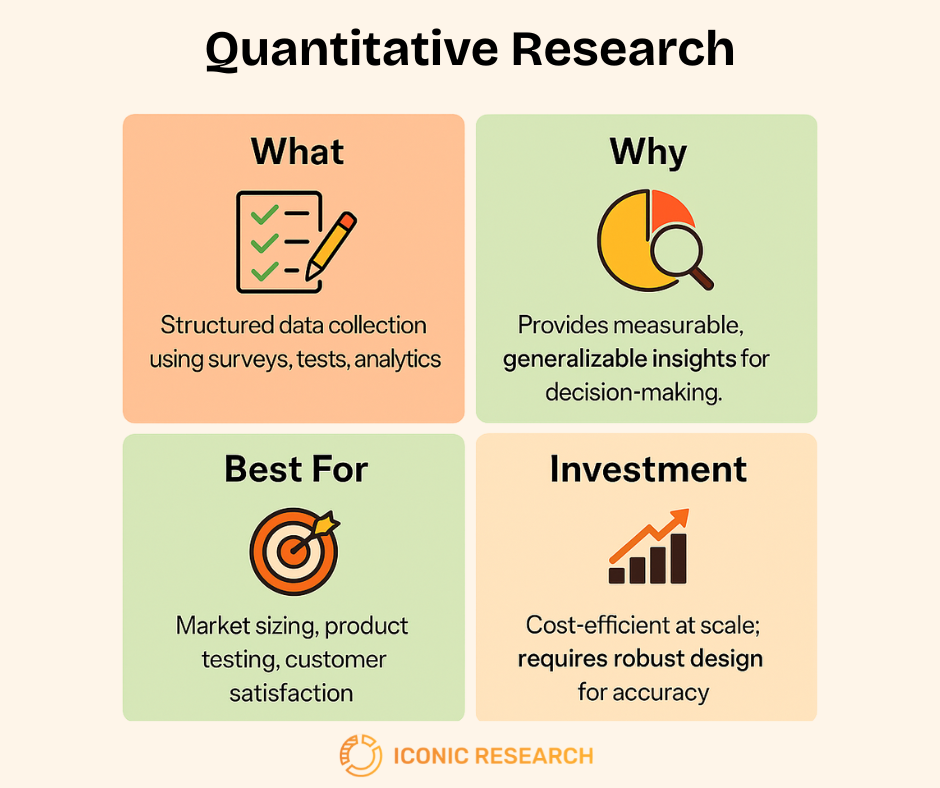
Quantitative research is a method of collecting and analyzing numerical data to measure patterns, test hypotheses, and support evidence-based decisions. Selecting the right data collection techniques is critical — in Thailand, response accuracy depends not just on sample size but also on factors like urban–rural differences, indirect communication styles, and digital adoption gaps that shape how people answer surveys.
Table of Contents
- Quantitative Research Topics in Thailand
- Quantitative Research Study Examples Iconic Research
- Research Methodologies That Work
- Data Collection Techniques in Thailand: How We Gather Research Data
- What is a Good Sample Size for Quantitative Research?
- Benefits and Limitations of Quantitative Research
- Future of Quantitative Research
- Conclusion & TL;DR
- References
As a local insight provider in Thailand, we frequently support clients with quantitative research projects across industries. Over the years, we’ve worked on everything from business surveys to academic studies, giving us a practical view of how quantitative research topics play out in the Thai market.
This article isn’t a formal academic guide—it’s a hands-on overview shaped by trial and error, client feedback, and even the occasional research disaster that taught us more than textbooks ever could. Along the way, we’ve learned when to rely on pure quantitative approaches and when to combine them with qualitative and quantitative research techniques to capture the full picture of Thai consumer behavior.
Quantitative Research Topics in Thailand
Business Research Areas That Drive Demand:
FMCG & Consumer Goods: Brands constantly need customer satisfaction metrics, brand tracking studies, and product usage pattern analysis. Think of companies launching new products who need to understand purchase drivers or measure advertising campaign effectiveness across different Thai regions.
Financial Services: Banks and fintech companies require market segmentation studies, price sensitivity analysis for new products, and digital adoption tracking. These clients often struggle with understanding how traditional banking preferences clash with digital innovation adoption patterns.
Retail & E-commerce: Store chains and online platforms need foot traffic analysis, customer journey mapping, and loyalty program effectiveness studies. The shift from traditional shopping to omnichannel experiences creates constant research needs.
Technology & Telecommunications: Companies entering the Thai market need technology adoption studies, user satisfaction surveys, and competitive positioning research. Understanding the gap between reported usage and actual behavioral patterns becomes critical for product development.
Academic and Social Research Areas:
Public Policy Development: Government agencies and NGOs need educational outcome measurements, healthcare accessibility studies, and social program effectiveness evaluations. These projects require understanding how cultural factors affect survey responses about sensitive topics.
University Research: Academic institutions conduct curriculum effectiveness studies, student satisfaction surveys, and employment outcome tracking. Mixed-methods approaches prove essential here since numbers alone miss cultural context around educational expectations.
Quantitative Research Study Examples Iconic Research
Offline Demographic Survey on Cost of Living in Thailand | Public Sector | 3,000 sample size
Stratified sampling across demographic segments delivered a comprehensive cost-of-living index that informed government social welfare policy decisions.
Next Generation Thailand Study | Education/Policy | 2,000 Thai youth (18-30)
This nationally representative survey combined with in depth interviews and focus groups provided critical insights for national youth development policies.
Organic Tea Market Expansion Strategy | Food & Beverage | 90-day duration
Quantitative consumer surveys (1,200 respondents) identified export opportunities and urban demand patterns, resulting in 40% domestic sales growth and successful international market entry.
Research Methodologies That Work
Types of Quantitative Research with Cultural Context
Let’s decipher the academic jargon and make the research types crystal clear and relevant to your actual business needs. There are four main approaches, each serving different purposes:
Descriptive Research – “What’s happening?” Simply measures and describes what exists right now. Think customer satisfaction scores, market share data, or demographic breakdowns. Example: Surveying 500 Bangkok consumers to understand current mobile payment usage rates.
Correlational Research – “What connects to what?” Identifies relationships between variables without proving causation. Example: You might discover that premium tea pricing correlates with higher customer loyalty in Thailand – but this doesn’t mean higher prices cause loyalty (it could be brand heritage, quality perception, or cultural status factors).
Causal-Comparative Research – “How do groups differ?” Compares existing groups to identify differences and potential causes. Example: Comparing customer loyalty between traditional bank users versus digital-only bank users to understand what drives retention.
Experimental Research – “What causes what?” Tests direct cause-and-effect by controlling variables. Example: Showing different product packaging designs to randomly selected consumer groups to measure which version drives higher purchase intent.
Data Collection Techniques in Thailand: How We Gather Research Data
Data collection techniques determine the quality of everything that follows. The method you choose shapes who you reach, how honestly they respond, and how much you can trust the numbers.
In Thailand, this choice is more consequential than in most markets. Online panels — the default data collection technique for many global agencies — systematically underrepresent rural populations, older demographics, and lower-income segments. For a market as regionally and socioeconomically diverse as Thailand, that bias isn’t a footnote. It’s a fundamental validity problem.
Our data collection approach is built around offline-first methodologies:
CAPI (Computer Assisted Personal Interviewing) — interviewers collect responses face-to-face using a tablet or device. Reaches segments that online surveys cannot, produces higher response quality, and allows interviewers to clarify questions in real time.
CATI (Computer Assisted Telephone Interviewing) — structured telephone interviews with trained interviewers. Effective for time-sensitive studies and hard-to-reach professional segments.
CLT (Central Location Test) — participants are recruited to a controlled venue to evaluate products, packaging, or concepts under consistent conditions. The gold standard for product testing and sensory research.
Online surveys — used selectively for existing customer feedback, employee research, or urban professional segments where panel composition is known and controlled.
The right data collection technique is never universal. It depends on who you need to reach, what you’re asking them, and what level of data quality your decisions require. We design collection methods around the research question — not around what’s cheapest or fastest to execute.
The Online vs Offline Research Dilemma
Most quantitative research today defaults to online surveys – they’re faster, cheaper, and easier to scale. You can reach thousands of respondents through digital panels, social media, or email campaigns. On the surface, this makes perfect sense in our connected world.
But here’s the problem we’ve encountered repeatedly in Thailand: online-only methodologies create systematic blind spots that can completely skew your findings.
The Digital-First Bias Problem
Despite smartphone ubiquity, online-only approaches miss crucial population segments. UOB and BCG’s ASEAN Consumer Sentiment study reveals vastly different digital adoption rates within the same market—while LINE dominates Thai social media, usage patterns diverge significantly between Bangkok’s tech-savvy millennials and Isaan’s traditional communities [3].
McKinsey’s Asia-Pacific research confirms these regional gaps, showing Bangkok consumers report higher digital trust levels while rural respondents express skepticism about online survey authenticity [4]. This creates bias in statistical research that relies exclusively on digital panels – you’re essentially surveying only the digitally comfortable population.
The practical impact? If you’re launching a product for the Thai market but only survey people comfortable with online forms, you miss the substantial cash-economy population who might be your actual customers.
Our Solution: Hybrid Methodologies
Go Qualitative or Quantitative?
While quantitative methods provide breadth and objectivity, qualitative approaches offer depth and context [2]. We’ve written extensively on quantitative techniques here and here, so we won’t be taking your precious time repeating well-known facts in detail.
Just remember that successful research projects often combine both qualitative and quantitative research techniques for comprehensive insights that address both statistical patterns and underlying motivations. Yes, it’s been said many times, but it remains perpetually relevant in Thailand’s context. Pure quantitative studies miss cultural nuances, while purely qualitative approaches can’t provide the scalability that clients need for business decisions.
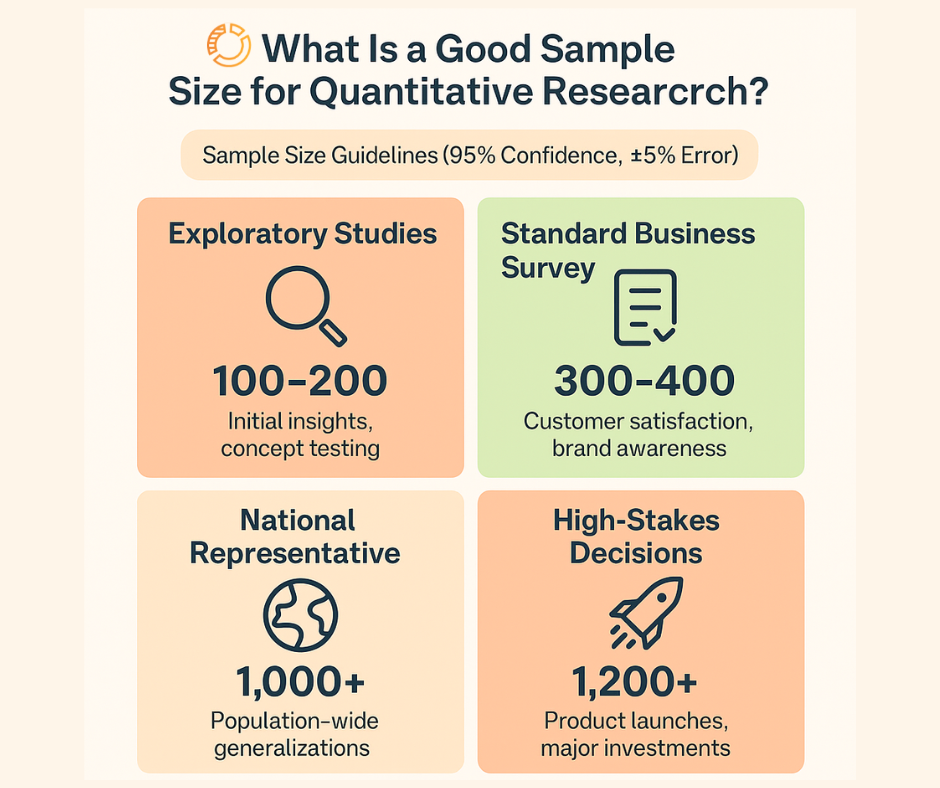
What is a Good Sample Size for Quantitative Research?
As you can see from the infographic, sample size requirements range from 100-200 for exploratory studies to 1,200+ for high-stakes business decisions, with standard business surveys typically needing 300-400 respondents.
In our practice, we’ve worked with different sample sizes depending on project scope – from focused studies with a few hundred respondents to nationwide research with 3,000+ participants. The key insight we’ve learned is that sample quality matters more than quantity, especially when cultural factors can dramatically affect response authenticity in Thai market contexts.
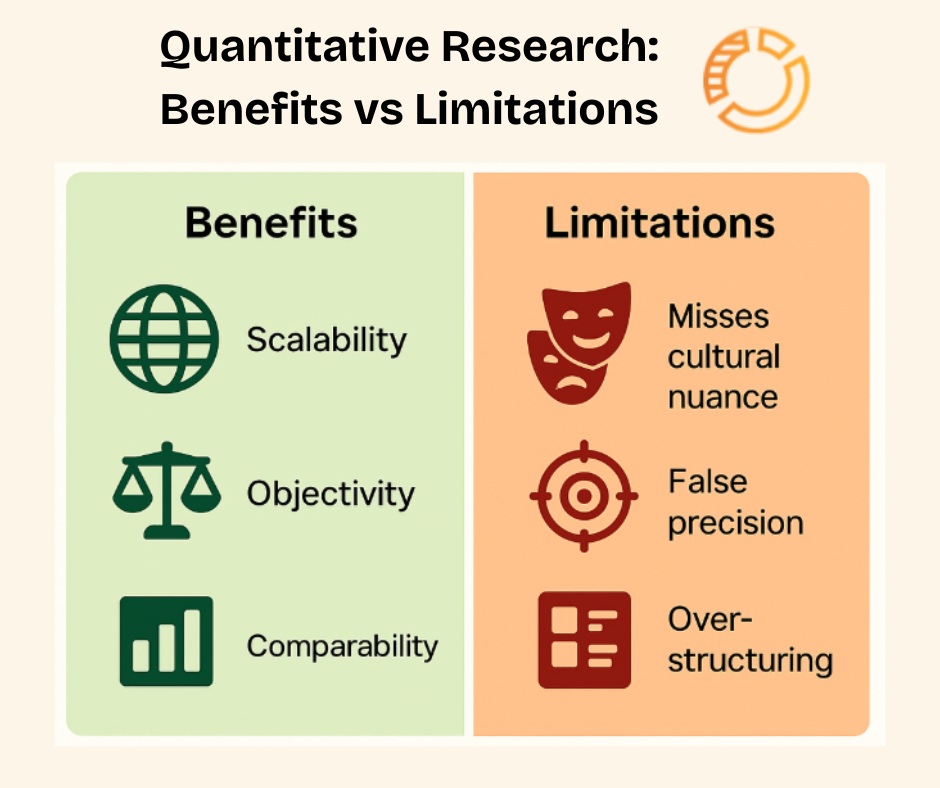
Benefits and Limitations of Quantitative Research
As you can see from the infographic, quantitative research has clear advantages but also significant limitations that become especially important in Thai market contexts.
The Three Key Benefits:
Scalability: You can survey thousands of people and make confident statements about entire markets. If 68% of your 800 respondents prefer Product A, you can reasonably assume this reflects broader market sentiment [7].
Objectivity: Numbers don’t lie (though they can mislead). Statistical analysis removes personal bias from findings and gives you concrete data to base decisions on rather than gut feelings or assumptions [8].
Comparability: You can benchmark your results against competitors, track changes over time, or compare different regions using the same metrics. This makes it invaluable for measuring progress and competitive positioning.
The Three Major Limitations:
Misses Cultural Nuance: Surveys can’t capture why someone answered the way they did. In Thailand, cultural factors like saving face or respect for authority can completely skew responses, making your “objective” data misleading.
False Precision: Just because you have numbers doesn’t mean they’re accurate. A survey showing “73.2% satisfaction” feels precise, but if respondents were giving socially acceptable answers rather than honest ones, that precision is meaningless.
Over-structuring: When you force complex human behaviors into multiple-choice answers, you lose the messy reality of how people actually think and make decisions. Sometimes the most important insights come from what people can’t or won’t put into a survey form.
Understanding both sides helps you use quantitative research effectively while recognizing when you need to supplement it with other approaches.
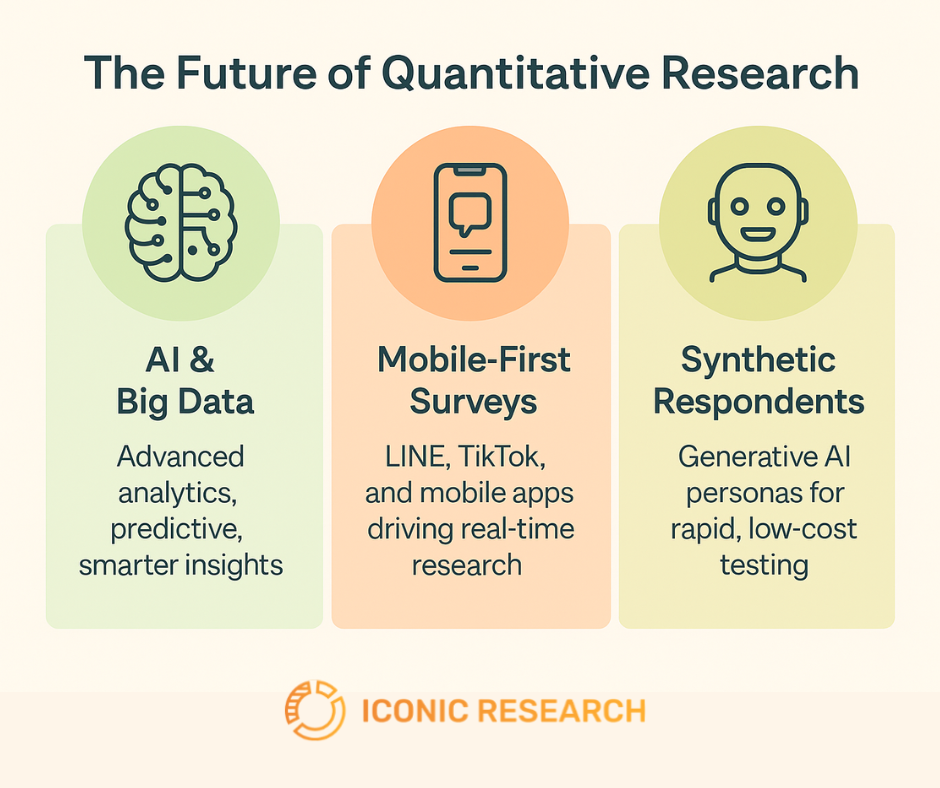
Future of Quantitative Research
The landscape of quantitative research continues evolving rapidly, particularly in dynamic markets like Thailand. AI has become a crucial part of social life for people here, especially the younger generation. One of our recent quantitative studies revealed that more than 60% of Thai youth use AI when making purchase decisions – from asking ChatGPT about product comparisons to using AI-powered apps for price hunting.
This shift creates new opportunities and challenges for researchers:
AI and Big Data Integration: Companies increasingly leverage artificial intelligence and machine learning to analyze massive datasets, enabling more sophisticated consumer behavior modeling and predictive analytics.
Mobile-First Methodologies: With near-universal smartphone adoption, platforms like LINE and TikTok provide new channels for real-time, high-volume survey responses, especially effective with Thai youth demographics.
Synthetic Data Generation: Advanced AI tools can simulate consumer personas and responses, allowing faster testing of products and campaigns. However, AI research shows synthetic data amplifies cultural misinterpretations, particularly around indirect communication and face-saving behaviors common in Thai decision-making [6]. In our practice, we don’t use synthetic personas – we rely on real, authentic insights from actual Thai consumers because cultural nuances simply can’t be artificially replicated. The future requires AI tools to complement—not replace—localized field research that captures authentic cultural behaviors.
Conclusion & TL;DR
- Quantitative research provides systematic, numerical data that enables evidence-based decision-making across business, healthcare, and policy applications
- Sample size matters less than authenticity – 250 honest responses beat 800 biased ones
- Mixed methods work best – combining numerical data with cultural insights
- Digital tools enhance capabilities but can’t replace cultural understanding
- Cultural adaptation is essential – especially in Thai markets where indirect communication affects response patterns
Thank you for reading, and we hope that our local insights will benefit your quantitative research in Thailand.
Frequently Asked Questions
What makes quantitative research different in Thailand compared to Western markets?
Cultural factors like hierarchy and face-saving behavior impact survey accuracy. Smaller samples (250-300) collected face-to-face often provide more reliable insights than larger online surveys that encourage socially acceptable rather than honest answers.
How is sample size determined in quantitative research?
Sample size calculation depends on desired confidence level (typically 95%), acceptable margin of error (usually 3-5%), and population variability.
When should businesses use quantitative vs qualitative research?
Use quantitative research to measure, predict, and generalize findings across large populations. Choose qualitative research to understand motivations, explore new concepts, or gain deep contextual insights.
References
[1] Researcher Life – Qualitative vs Quantitative Research: Differences, Examples, Methods | https://researcher.life/blog/article/qualitative-vs-quantitative-research/
[2] Simply Psychology – Qualitative vs Quantitative Research Overview | https://www.simplypsychology.org/qualitative-quantitative.html
[3] UOB & BCG – ASEAN Consumer Sentiment Study (2023) | https://www.bcg.com/publications/2023/asean-consumer-sentiment-study
[4] McKinsey & Company – Consumer Sentiment in Asia-Pacific (2024) | https://www.mckinsey.com/industries/consumer-packaged-goods/our-insights/an-update-on-consumer-sentiment-in-asia-pacific
[5] Qualtrics – How to Determine Sample Size | https://www.qualtrics.com/experience-management/research/determine-sample-size/
[6] Cultural Bias in Explainable AI Research: A Systematic Analysis (2024) | https://arxiv.org/abs/2403.05579
[7] Predictive – Qualitative data VS Quantitative data เลือกใช้อย่างไรให้ตอบโจทย์ธุรกิจ | https://predictive.co.th/blog/qualitative-data-vs-quantitative-data-2/
[8]IDEASCALE – การวิจัยเชิงปริมาณคืออะไร คำจำกัดความ ตัวอย่าง ข้อได้เปรียบหลัก วิธีการ และแนวทางปฏิบัติที่ดีที่สุด | https://ideascale.com/th/บล็อก/kaarwicchayechingprimaankhuue-aair/
If you wish to quote any information from this article, please kindly cite the source along with the link to the original article to respect copyright. |
Iconic Research Thailand Your trusted partner in market research and consulting across Thailand and Southeast Asia. Headquartered in Bangkok, we provide research-driven insights across the Philippines, Malaysia, Indonesia, Singapore, Laos, and Vietnam. We help businesses navigate Thailand's market complexities through consumer insights, market entry strategy, and trend foresight. Contact us if you have any queries! (+66)888 954 954 |
Contact us
We always looking for new and exciting opportunities. Let’s connect.
Related posts
 AI Thailand: The Opportunity Is Real, But So Is the Complexity
Thailand’s AI market is projected to reach 114 billion baht by 2030, yet most Thai consumers remain cautious. Understanding who they are – and what they actually need from AI – is the difference between a product that lands and one that doesn’t.
13 min read Thailand 4.0 in 2026: An Investor’s Blueprint for the Innovation Economy
Thailand 4.0 has reached a defining year in 2026 – transitioning from policy vision to operational reality with AI integration, EV manufacturing, and digital infrastructure driving the innovation economy.
9 min read Unlocking the “Why” Behind Thai Culture: Introducing PhumPanya
Thai culture can feel like a puzzle. At PhumPanya, we believe the key to understanding Thai language and culture is in the words themselves. Explore our free database of Thai words, their roots, and the cultural logic hidden inside the language.
3 min read