Data collection in market research determine whether findings are representative or misleading. This guide covers primary and secondary data collection methods — what each produces, where each fails, and how to match method to research objective in Thailand’s culturally and regionally complex market.
Table of Contents
- Primary and Secondary Data Collection
- Qualitative Data Collection Techniques
- Quantitative Data Collection Techniques
- How to Choose the Right Data Collection Methods
- Data Collection Challenges in Thailand
- Digital Data Collection Methods
- When to Commission Primary Data Collection
- References
Choosing the right data collection techniques — whether qualitative or quantitative, primary or secondary, face-to-face or digital — determines not just what you find but whether you can trust what you find. In Thailand, the same technique that produces reliable data in Bangkok frequently produces unreliable data in provincial markets, and the same instrument that works for middle-income respondents fails systematically with lower-income segments. The technique is not neutral.
Primary and Secondary Data Collection
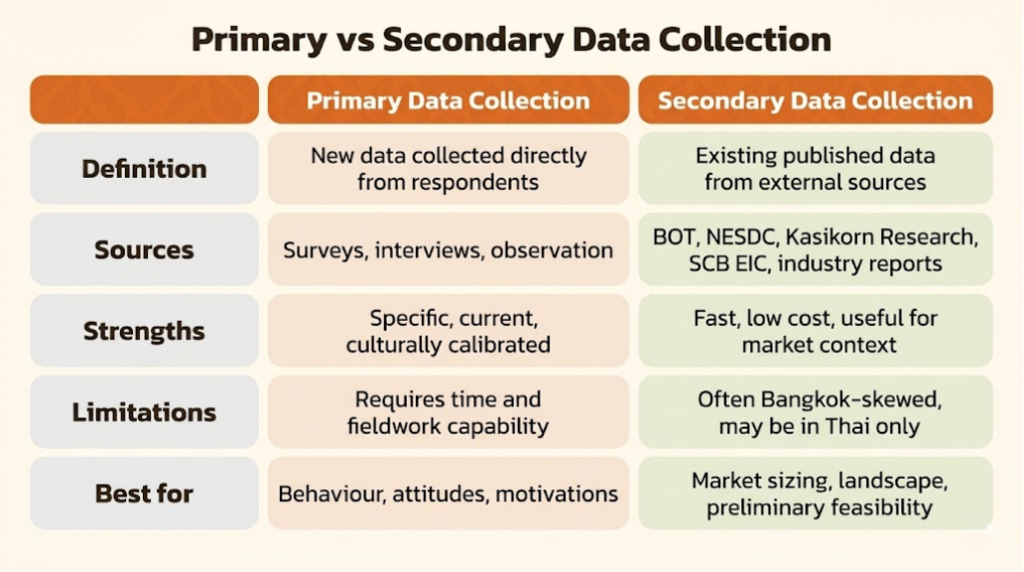
Thailand’s authoritative secondary data is distributed across multiple institutional sources, most published in Thai. For international teams, navigating these sources requires local language capability and an understanding of what each source reliably covers — and what it does not.
Key secondary sources for Thailand research:
• Bank of Thailand — bot.or.th — Monetary data, household debt, financial sector indicators. English summaries available.
• NESDC — nesdc.go.th — GDP by sector, household income surveys, poverty data. Primary source for market sizing. Mostly Thai.
• Department of Business Development — dbd.go.th — Company registrations by sector and province. Essential for B2B landscape mapping.
• Kasikorn Research Center — kasikornresearch.com — Sector market reports and consumer spending analysis. Frequently updated; some English content.
• SCB Economic Intelligence Center — scbeic.com — Consumer behaviour and economic trends. Strong FMCG and retail coverage. English available.
• Thailand BOI — boi.go.th — FDI data, investment approvals, incentive sector classifications. English interface.
• ETDA — etda.or.th — Digital behaviour, internet user data, e-commerce statistics. English available.
Coverage across all sources skews Bangkok. Secondary data sets the frame — primary data collection fills what it cannot reach.
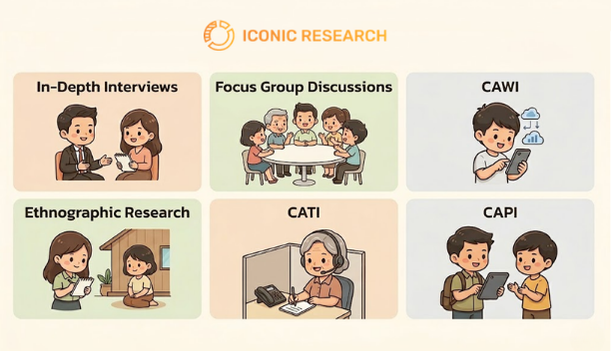
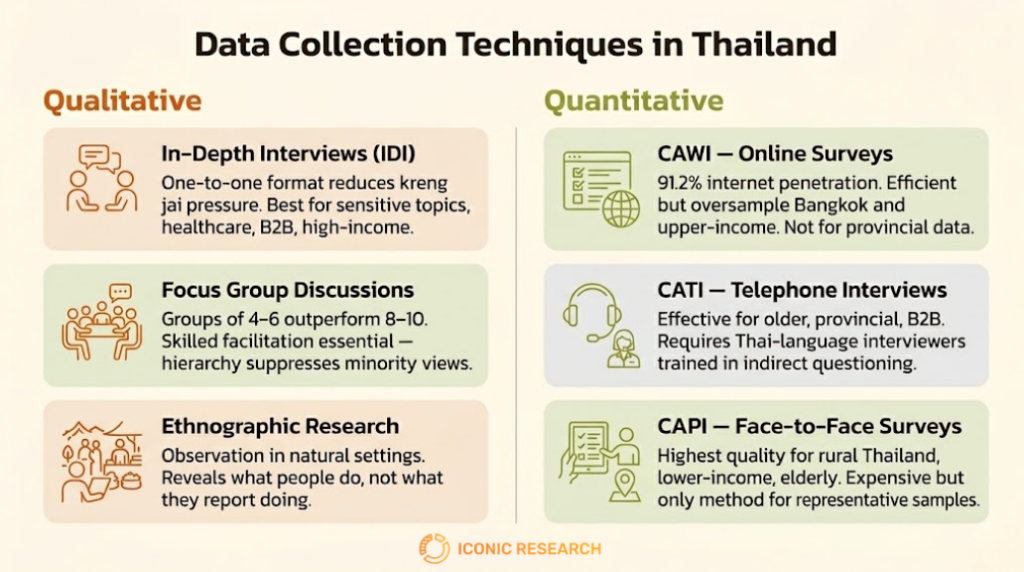
Qualitative Data Collection Techniques
Qualitative research relies on three core data collection techniques in Thailand, each shaped by the country’s communication culture.
In-depth interviews are the most effective qualitative data collection technique for individual-level insight. One-to-one format reduces the kreng jai pressure that group settings amplify — Thai respondents self-censor in groups to avoid causing discomfort or appearing to disagree with peers. IDIs produce more candid data on sensitive topics, high-involvement decisions, and professional opinion, and are particularly effective for healthcare professionals, B2B buyers, and high-income consumers [4].
Focus group discussions are effective for observing social consensus formation and testing how ideas land in a group context. Thailand-specific challenge: social hierarchy means dominant participants suppress minority views, making skilled facilitation essential. Small groups of four to six outperform standard groups of eight to ten — they reduce the deference dynamic and produce more genuine interaction, particularly for sensitive categories and higher-income respondents.
Ethnographic research — observation in natural settings — captures behaviour that surveys and interviews miss. In Thailand the gap between stated and actual behaviour is significant in categories shaped by social norms: food choices, health practices, financial behaviour. In-home ethnography and accompanied shopping reveal what people do rather than what they report doing, and are particularly effective for FMCG, health and beauty, and technology categories where usage context shapes product experience.
Mystery shopper programmes are a structured form of covert field observation — capturing actual service standards and sales interactions rather than respondent-reported behaviour.
Quantitative Data Collection Techniques
Quantitative research in Thailand uses three primary data collection methods, each with distinct reach, cost, and quality implications.
CAWI — online surveys delivered via web or mobile — is efficient and scalable for urban, younger, and higher-income respondents. Thailand has 91.2% internet penetration and among the highest mobile usage rates in Southeast Asia [1]. The critical limitation: online panels in Thailand oversample Bangkok and middle-to-upper income respondents. Any brief requiring provincial Thailand or lower-income segments will produce a structurally skewed sample from online-only data collection.
For a full breakdown of market survey types used in quantitative research across Thailand, see our market survey guide.
CATI — structured telephone interviews with pre-recruited respondents — is effective for older demographics, provincial populations, and B2B research where decision-makers will not complete online surveys. CATI fieldwork research allows trained interviewers to probe and manage the interview dynamic. It requires Thai-language interviewers trained in indirect questioning — script reading without cultural calibration produces acquiescence bias at scale.
CAPI — face-to-face surveys conducted by trained interviewers using tablets — is the highest-quality quantitative data collection method for rural Thailand, lower-income segments, and elderly respondents. It is more expensive and logistically complex than CAWI, but for nationally representative samples it is often the only method that reaches the segments that matter. Face-to-face interviewers can build rapport, clarify misunderstood questions, and detect disengagement in ways self-completion surveys cannot [4].
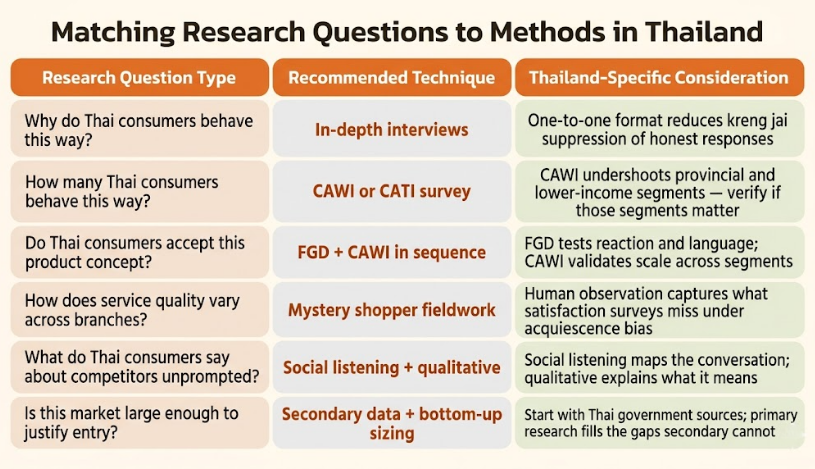
How to Choose the Right Data Collection Methods
The technique follows the question — not the budget, not the timeline, not the method the last project used. Before selecting a data collection technique, the commercial decision the research must support needs to be stated explicitly. What changes as a result of this data?
When face-to-face outweighs the cost premium: whenever the target population is outside Bangkok, over 55, lower-income, or in a category where social desirability shapes reported behaviour. The extra cost of CAPI fieldwork in provincial Thailand is consistently less than the cost of a business decision built on Bangkok panel data presented as national insight.
Data Collection Challenges in Thailand
Kreng jai and acquiescence bias: Thai respondents consistently skew positive — rating satisfaction higher, agreeing more readily, and avoiding direct negative expression in face-to-face settings. This is not dishonesty — it is a deeply embedded cultural norm of not wanting to cause discomfort or impose a negative view. Data collection instruments designed for Western respondents will systematically overstate satisfaction and agreement when used with Thai respondents without adjustment. Reverse-scored items, indirect questioning, and skilled probing are required to access genuine attitudes beneath polite surface responses [3][4].
Bangkok is not Thailand: Most online panels, research agency databases, and published secondary data reflect Bangkok. Thailand’s provincial markets — approximately 60% of the population — behave differently across income levels, media consumption, and purchase triggers [5]. Research designed and executed from Bangkok produces Bangkok data. For brands operating beyond the capital, provincial data collection requires regional fieldwork teams, local language adaptation, and sampling frames that do not default to urban digital panels. The Bangkok assumption is the most common and most costly data collection error in Thailand research.
Digital Data Collection Methods
Online surveys via web and mobile dominate digital data collection in Thailand given high smartphone penetration. Social media polls provide fast real-time sentiment but are not representative samples. QR code surveys work well for retail and event-based data collection. LINE warrants specific attention — with 56 million monthly active users, LINE Official Accounts enable survey distribution directly to opted-in brand audiences at scale [1]. Instruments must be built and delivered in Thai, and LINE’s private messaging environment remains inaccessible to research tools outside Official Account infrastructure.
When to Commission Primary Data Collection
Secondary data is sufficient when the brief requires market context and macro-level sizing, you are at early feasibility stage before committing primary research budget, published data on the category is recent and available in English, and the decision can be made on directional rather than precise evidence. See our feasibility study service for where secondary research fits into a structured market assessment.
Primary data collection and fieldwork are necessary when the question requires understanding behaviour, attitudes, or motivations — not just market size. Also when the target segment is underrepresented in published data — provincial Thailand, lower-income consumers, specialist professionals — or when willingness-to-pay, product response, or concept acceptance needs to be measured rather than assumed. When Bangkok versus provincial differences materially affect the business case, primary data collection is the only way to produce defensible evidence [5].
Frequently Asked Questions
What is the difference between primary and secondary data collection?
Primary data collection generates new data directly from respondents for a specific research question. Secondary data uses existing published sources — faster and cheaper but may be outdated, Bangkok-skewed, or unavailable in English for Thailand-specific categories.
Which data collection technique works best in Thailand?
It depends on the segment and the research question. Qualitative techniques suit sensitive topics and professional segments. CAPI face-to-face fieldwork is required for provincial, rural, elderly, or lower-income respondents. Most robust Thailand research combines methods rather than relying on a single channel.
How do you collect data from provincial Thailand respondents?
Face-to-face CAPI fieldwork with locally embedded teams and regional coordinators who adapt language and approach to each area. Online panels do not reliably represent provincial Thailand — they structurally oversample Bangkok.
How does kreng jai affect data quality in Thailand?
It produces acquiescence bias — Thai respondents tend to agree, rate positively, and avoid direct negative expression. Quality data collection in Thailand requires indirect questioning techniques, reverse-scored scale items, and skilled facilitation that builds enough trust for genuine responses.
What is CAPI fieldwork?
CAPI stands for Computer-Assisted Personal Interview — face-to-face surveys conducted by trained interviewers using tablets. It produces higher data quality than online surveys for hard-to-reach, provincial, and lower-income Thai respondents.
References
[1] DataReportal. “Digital 2025: Thailand.” January 2025. https://datareportal.com/reports/digital-2025-thailand
[2] Bank of Thailand. Statistics and economic data. https://www.bot.or.th/en/statistics.html
[3] Smith, P.B. “Acquiescent Response Bias as an Aspect of Cultural Communication Style.” Journal of Cross-Cultural Psychology, 2004. https://journals.sagepub.com/doi/10.1177/0022022103260380
[4] Sage Research Methods. “Acquiescence Response Bias.” Encyclopedia of Survey Research Methods. https://methods.sagepub.com/ency/edvol/encyclopedia-of-survey-research-methods/chpt/acquiescence-response-bias
[5] Iconic Research. “Fieldwork and Research Recruitment in Thailand.” https://iconicthai.com/services/fieldwork/
If you wish to quote any information from this article, please kindly cite the source along with the link to the original article to respect copyright. |
Iconic Research Thailand Your trusted partner in market research and consulting across Thailand and Southeast Asia. Headquartered in Bangkok, we provide research-driven insights across the Philippines, Malaysia, Indonesia, Singapore, Laos, and Vietnam. We help businesses navigate Thailand's market complexities through consumer insights, market entry strategy, and trend foresight. Contact us if you have any queries! (+66)888 954 954 |
Contact us
We always looking for new and exciting opportunities. Let’s connect.
Related posts
 Brand Strategy: The Decisions That Should Be Built on Evidence
Brand strategy is the set of decisions that determine how a brand competes. Those decisions only pay off when they’re built on consumer evidence — not a workshop.
11 min read Key Opinion Leader: What Thai Brands Should Research Before, During, and After a KOL Campaign
Platform metrics mislead brands choosing and measuring KOLs in Thailand. A research-first look at what to verify before, during, and after a campaign.
10 min read Customer Persona: Build One That Reflects Real Thai Consumers
Most Thai brands have customer personas built from assumptions. Research-backed personas reveal a different consumer — and drive different decisions.
9 min read