

A perceptual map, also called a positioning map, is a two-axis chart showing how consumers position competing brands relative to each other on the attributes that matter to them. It is built from survey data — top of mind and aided awareness, brand recall, and attribute ratings for every brand in the competitive set — not from management opinion. Brands use it to find white space, to check whether the positioning they intend is the one consumers perceive, and to track movement between waves. Iconic Research builds perceptual maps in Thailand as part of brand research programmes, with attributes drawn from qualitative work, fieldwork across Bangkok and the provinces, and rating scales adjusted for Thai response patterns.
Table of Contents
- What Is a Perceptual Map (Positioning Map)?
- Where the Data Comes From
- How Iconic Research Builds a Perceptual Map
- Reading the Map
- Perceptual Mapping in Thailand
- From One Map to Brand Tracking
- Conclusion
- References
A perceptual map answers the question most brand reviews leave open: where does the brand actually sit in consumers’ minds, compared with the brands it competes against? Management usually has a view — the segment ladder on the strategy slide. A perceptual map tests it against measured brand perception, and the two rarely match.
Iconic Research is a market research agency in Bangkok that builds perceptual maps for Thai corporates and international brands as part of brand research programmes. This article explains what a perceptual map is, where its data comes from, and how a study runs, using a worked case from the Thai air conditioner category.
What Is a Perceptual Map (Positioning Map)?
A perceptual map plots brands as points on two axes, each an attribute consumers use to judge the category: price against perceived quality, traditional against modern. Brands consumers see as similar sit close together. It is a picture of brand perception, not of market share or price list [1].
The term is used loosely. A perceptual positioning map, a brand perceptual map and a positioning map describe the same object, with one distinction worth keeping: a positioning map can show where a brand intends to be; a perceptual map shows where consumers place it. One is a plan, the other evidence.
Where the Data Comes From
A perceptual map is only as good as the brand perception data behind it. Three inputs are needed, all from a quantitative survey of category buyers.
The first is awareness. Unaided awareness asks which brands come to mind when the category is named; the first named is top of mind. Aided awareness shows a list and asks which the respondent recognises. The gap between aided and unaided awareness shows how much recognition is active rather than latent [2].
The second is brand recall in context: for a specific need or price point, which brands come to mind? A brand may have high overall recall but be recalled only in the value segment.
The third is attribute ratings per brand. These are the coordinates. Without them there is only a list of awareness scores — which is what most published brand rankings in Thailand are. The Marketeer No.1 Brand Thailand survey names the most popular brand in each category, air conditioners included [3]: a useful recall benchmark that says nothing about where brands sit relative to each other.
A map drawn in a workshop is not a perceptual map either. Logos on a whiteboard are a hypothesis; it becomes a perceptual map only once consumers, not managers, have supplied the positions.
How Iconic Research Builds a Perceptual Map
Five steps: define the competitive set, draw the attributes from qualitative research, field a quantitative survey, analyse the ratings into a map, and plot by segment and region. A case shows them best.
The business issue. A Thai air conditioner brand has positioned itself as medium-high: better engineered than the mass brands sold through hypermarkets, priced below the Japanese brands that lead the category. Around it, Chinese manufacturers are building plants in Chonburi and competing hard on price and smart features [4]. Marketing wants to know whether buyers see the brand where the segment ladder puts it, before committing to a national “step-up” campaign.
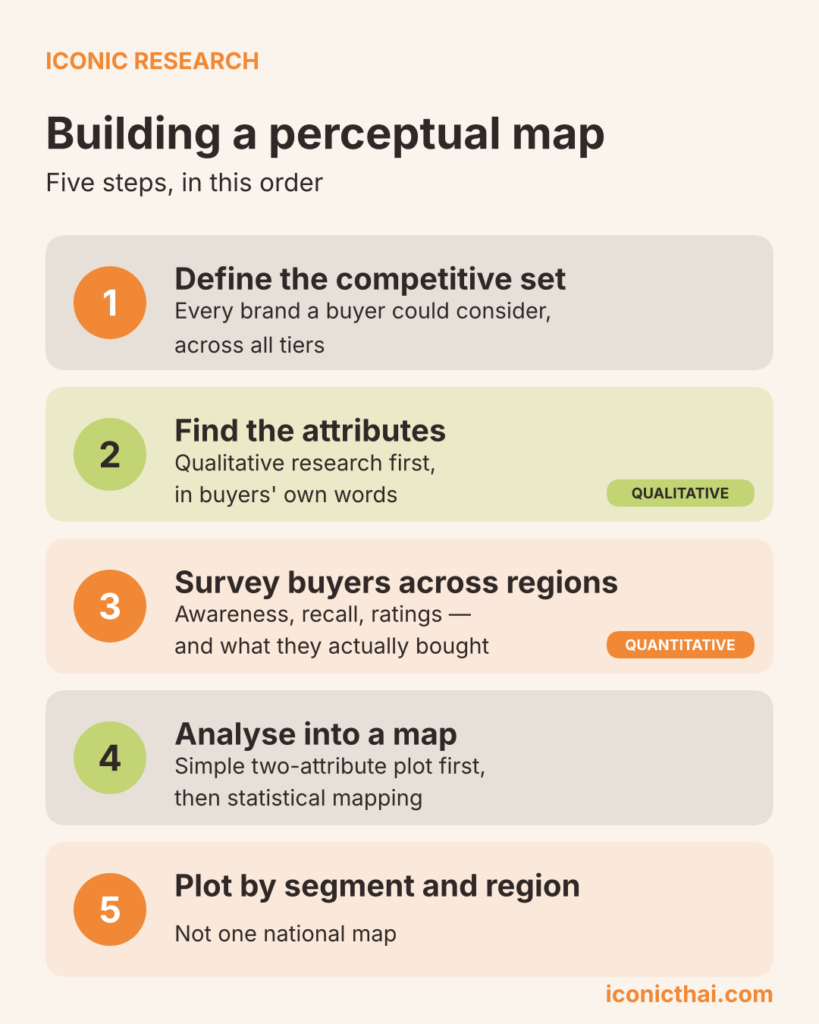
Step one: define the competitive set — every brand a buyer could consider, across all tiers. Competitor analysis settles which brands go on the map: not the four the client calls peers, but two Japanese leaders, one Korean, two Chinese entrants, the two mass brands. Leaving the mass brands off would have hidden the most important finding.
Step two: draw the attributes from qualitative research, in buyers’ own words, not from the brief. Qualitative research comes first: focus groups with homeowners in each tier, plus in-depth interviews with installers and dealers, who in this category recommend the brand more often than advertising does. The brief listed “innovation” and “energy saving”. Buyers talked about whether the brand is Thai or Japanese and whether a technician will come within a day. Those became the attributes.
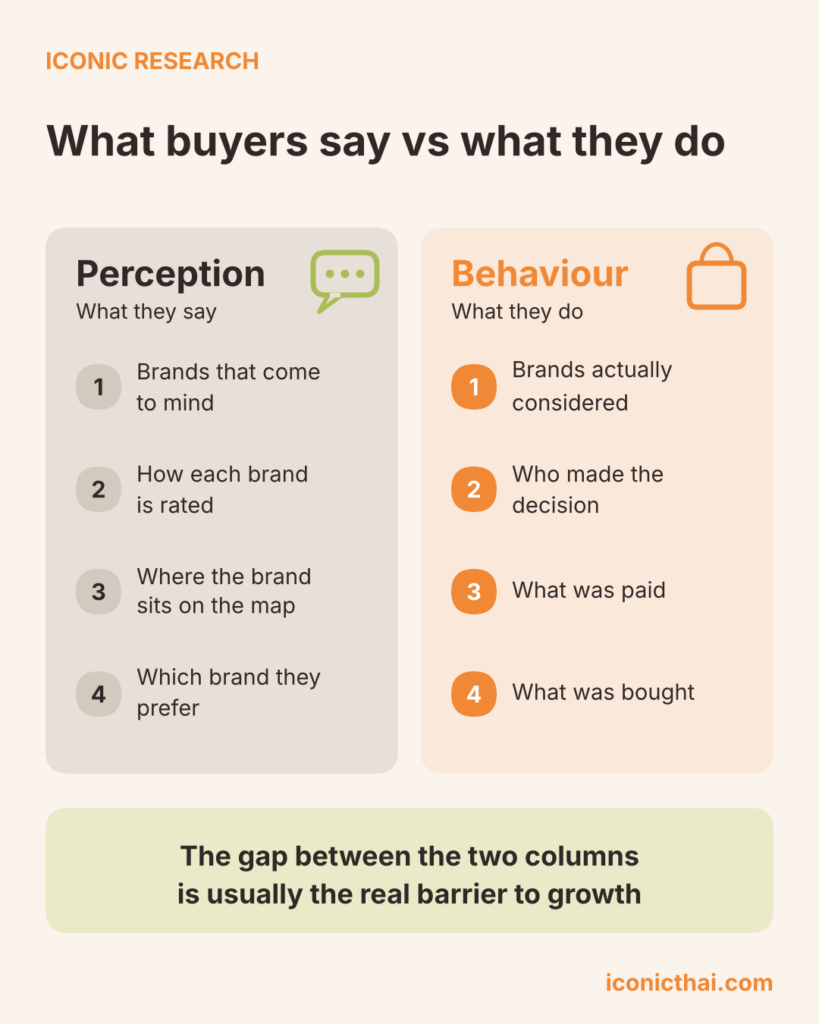
Step three: field a quantitative survey of category buyers, across regions, measuring awareness, recall and attribute ratings. Quantitative research with recent and intending buyers across Bangkok and four provinces, plus a smaller sample of installers and dealers. Every respondent gives unaided and aided awareness, recall by situation, and attribute ratings for the brands they know. The survey also records what they did, not only what they think: which brand came to mind in the buying situation they were actually in, which brands they considered last time, who decided, what was paid, and whether what they bought was what they first chose. Perception and willingness to pay are asked separately, because a brand can be perceived as premium by buyers who would never pay the premium.
Step four: analyse the ratings into a map — a direct two-attribute plot first, then multidimensional scaling or correspondence analysis if more attributes matter. The direct plot is the first thing to look at. Multidimensional scaling takes consumers’ judgements of how similar brands are and finds the two-dimensional arrangement that best preserves those distances [1]. Correspondence analysis plots brands and attributes on the same chart, so the map shows which attributes pull each brand where [1].
Step five: plot one map per segment and per region, not one national map. A national map would have averaged away the result.
Reading the Map
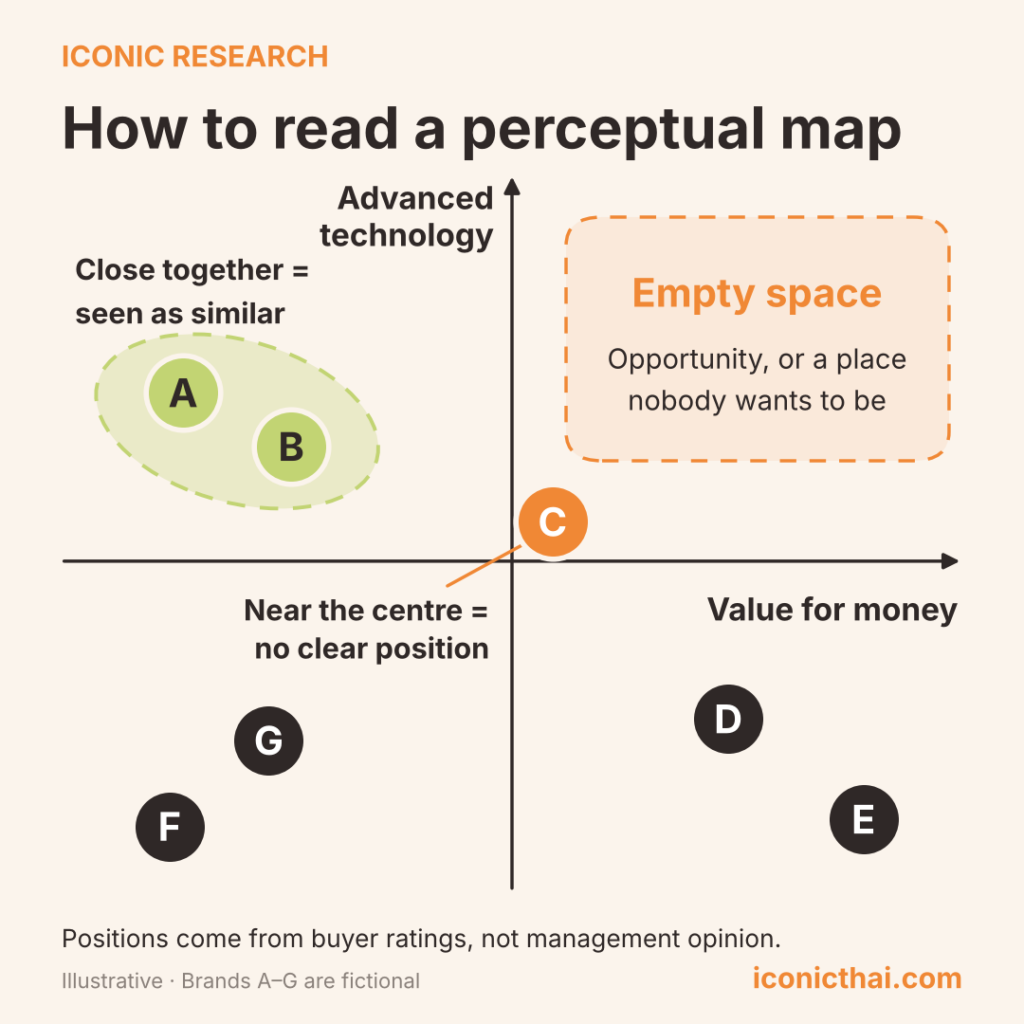
Three rules: brands close together are seen as similar; an empty quadrant is either an opportunity or a place nobody wants to be; a brand near the centre stands for nothing in particular.
For the brand, the study delivers one map per region, the top of mind and recall figures behind each position, and the purchase data set against them. That last layer matters most: where buyers rate a brand well but did not buy it, the gap between what they say and what they do is usually the real barrier, and rarely the one they name.
Perceptual Mapping in Thailand
Two things change when perceptual mapping is done with Thai consumers.
The cues and the geography. Thai buyers judge brands on things global frameworks leave out — the parent group’s reputation, service in their province, the installer’s recommendation, country of origin — and perception in Chiang Mai, Khon Kaen or Phuket differs from Bangkok because distribution, service and the competitive set differ. A Bangkok-only sample produces a Bangkok map.
The rating scales. Thai respondents, like those in several Asian markets, lean toward agreement and the positive end of a scale, so every brand scores well on everything and a map built from raw ratings compresses into a cluster where the differences that matter are too small to read. A multi-country study that included Thailand found that ranking rather than rating removes most of this distortion [5]. The fix is built into the questionnaire: forced ranking of brands on each attribute, relative questions alongside absolute ones, and centring each respondent’s ratings on their own average before analysis.
From One Map to Brand Tracking
The first perceptual map is a baseline study: a brand benchmark showing where the brand and each competitor sit, with the top of mind and recall figures that go with those positions. Repeating the same survey in waves turns it into brand tracking [2]. The questions must stay identical, down to the attribute wording, or movement on the map cannot be separated from a change in the instrument.
A repeat is worth it when something should have moved perception — a campaign, a new sub-brand, a push into the provinces, a competitor entering the tier — or when a top of mind or recall target has been set. It is not worth it when nothing has changed. Used this way, the map is a competitor benchmark, and perceptual map marketing decisions — which attribute to claim, which tier to defend, where the sub-brand belongs — rest on measured brand perception rather than on the ladder the brand drew for itself.
Conclusion
A perceptual map is the clearest single test of whether a brand’s intended position is the one consumers perceive. Built from buyer data, it shows white space, misplaced positioning and sub-brand leakage that no sales report will reveal. Built from internal opinion, it is a drawing.
Iconic Research builds perceptual maps as part of brand strategy consulting programmes in Thailand, combining qualitative attribute discovery with quantitative research across Bangkok and the provinces. To scope a baseline for your category, contact us.
Frequently Asked Questions
What is a perceptual map?
A perceptual map is a two-axis chart showing how consumers position competing brands relative to each other on the attributes that matter in the category. It is built from survey data on awareness, brand recall and attribute ratings.
What is the difference between a perceptual map and a positioning map?
In practice the terms are used interchangeably. Where a distinction is drawn, a positioning map shows where a brand intends to sit and a perceptual map shows where consumers actually place it.
What is top of mind awareness?
Top of mind awareness is the share of consumers who name a brand first, unprompted, when the category is mentioned. It is the strongest form of unaided awareness.
How many brands should a perceptual map include?
Every brand a buyer in the category could reasonably consider, across all price tiers, not only the client's direct competitors. Too few flatters the client; too many and respondents cannot rate them all.
How is a perceptual map different from brand tracking?
A single perceptual map is a baseline snapshot of brand perception. Brand tracking repeats the same survey in waves and compares the maps to show whether a brand's position has moved.
References
[1] Lilien, G. L., Rangaswamy, A., & De Bruyn, A. (2017). Principles of Marketing Engineering and Analytics (3rd ed.). DecisionPro. ISBN 978-0985764821.
[2] Aaker, D. A. (1991). Managing Brand Equity: Capitalizing on the Value of a Brand Name. Free Press. ISBN 978-0029001011.
[3] Marketeer (2026). Marketeer No.1 Brand Thailand 2026. Brand popularity survey of more than 6,500 respondents nationwide across 123 product categories. https://marketeeronline.co/archives/477309
[4] ASEAN Briefing (2025). Thailand: A Global Leader in Air Conditioner Manufacturing and Export. https://www.aseanbriefing.com/news/thailand-a-global-leader-in-air-conditioner-manufacturing-and-export/
[5] Harzing, A.-W., et al. (2009). Rating versus ranking: What is the best way to reduce response and language bias in cross-national research? International Business Review, 18(4), 417–432. https://doi.org/10.1016/j.ibusrev.2009.03.001
If you wish to quote any information from this article, please kindly cite the source along with the link to the original article to respect copyright. |
 |
Iconic Research Thailand Your trusted partner in market research and consulting across Thailand and Southeast Asia. Headquartered in Bangkok, we provide research-driven insights across the Philippines, Malaysia, Indonesia, Singapore, Laos, and Vietnam. We help businesses navigate Thailand's market complexities through consumer insights, market entry strategy, and trend foresight. Contact us if you have any queries! (+66)888 954 954 |
Contact us
We always looking for new and exciting opportunities. Let’s connect.
Related posts
 Usability Testing: Methods, Metrics and How It Works in Thailand
How usability testing works, which methods and metrics to use, and what changes when the users are Thai.
11 min read Thailand Car Sales by Brand: Top Models and EVs in 5 Charts
Five charts from 2025 Department of Land Transport registrations: which car brands and models Thais bought, and how many new cars were electric.
5 min read Young Thais Put Financial Security Before Marriage: Next Generation Thailand in 7 Charts
Seven charts from Next Generation Thailand, a survey of 2,000 Thais aged 18–30: who shapes their views, which news sources they trust, what they count as success, and where they’d move.
9 min read