Food Delivery Market Share in Thailand: Platform Data and Market Analysis
10 min readGrabFood holds 35% of food delivery market share in Thailand, LINE MAN sits at 33%, and Foodpanda’s exit in May 2025 has consolidated a market that reached an estimated 100 billion baht — up from 35 billion baht in 2019. The competitive dynamics have shifted materially: three major platforms now divide a market that once had four, commission structures remain a source of pressure for restaurant partners, and generational usage patterns are diverging in ways that affect platform strategy. This analysis covers the market size, platform positioning, economics, and consumer behaviour data relevant to F&B brands, platform investors, and strategy teams assessing this sector.
Table of Contents
- Thailand’s Food Delivery Market Size
- Food Delivery Market Share in Thailand: Platform Breakdown
- Platform Economics — Commission Fees and Delivery Costs
- Consumer Behaviour and Generational Breakdown
- Food Delivery Industry Trends — What Shapes the Market Next
- Research Applications for F&B Brands and Platform Operators
- Conclusion & Key Data Points
- References
Thailand’s Food Delivery Market Size
The Thailand food delivery market has followed a steep growth trajectory over the past six years. The market stood at approximately 35 billion baht in 2019, nearly doubled to 68 billion baht in 2020 driven by pandemic-related behavioural shifts, and reached an estimated 100 billion baht by 2025 [5]. That growth rate — roughly 185% over five years — reflects both structural demand for delivery infrastructure and the accelerated digital adoption that characterised the post-pandemic period across Southeast Asia’s food delivery market.
The market operates within Thailand’s broader FMCG landscape, where digital channel adoption across food and beverage categories has fundamentally restructured consumer access to both international chains and independent restaurants. Urban concentration remains significant — Bangkok and the surrounding metropolitan area account for a disproportionate share of order volume — but platform expansion into secondary cities has widened the addressable market considerably.
Food Delivery Market Share in Thailand: Platform Breakdown
According to Rakuten Insight survey data [1], food delivery market share in Thailand as of the most recent full competitive period was distributed as follows:
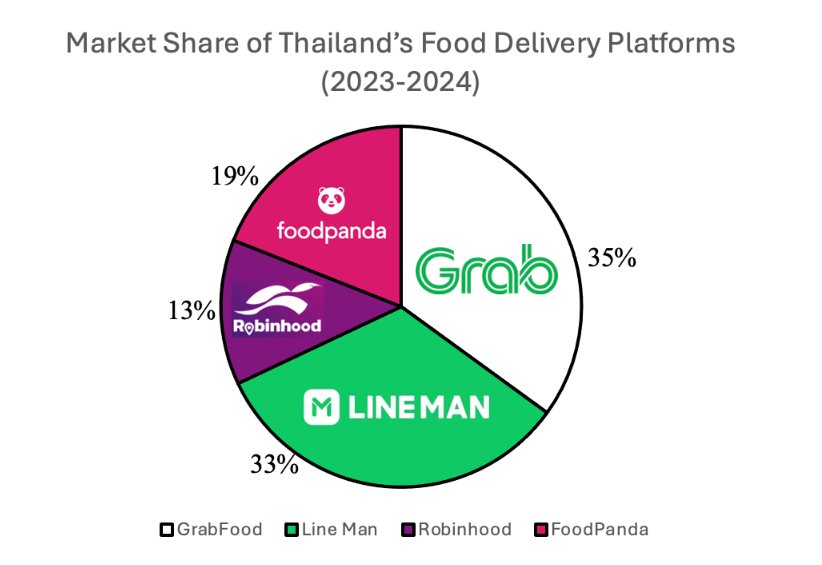
GrabFood’s position reflects its early mover advantage and the depth of its rider network, which extends into areas where competing platforms have limited coverage. The Grab ecosystem — ride-hailing, payments, financial services — creates platform stickiness that pure-play delivery competitors cannot easily replicate.
LINE MAN’s 33% share is structurally different in origin. Its growth was driven by the LINE messaging platform’s existing penetration among Thai users, which gave LINE MAN a pre-built communication and loyalty channel. The integration of ordering, payment, and post-purchase support within a messaging environment that Thai consumers already use daily has proved durable.
Robinhood’s 13% share and zero-commission model for restaurants represents a deliberate positioning against the platform economics that competitors use. Its restaurant partner base — particularly among independent operators and street food vendors — has been a point of differentiation, though its scale relative to GrabFood and LINE MAN limits its competitive reach.
Foodpanda, which held 19% before its exit, withdrew from Thailand in May 2025 following sustained financial losses and a strategic review by its parent company [2]. The redistribution of Foodpanda’s user base and restaurant partnerships among the remaining active platforms is an ongoing competitive dynamic with implications for both GrabFood and LINE MAN’s near-term market share trajectory.
Platform Economics — Commission Fees and Delivery Costs
Understanding commission structures is central to any assessment of restaurant partnership viability or platform investment in this market. The following table reflects the economics of active platforms following Foodpanda’s exit [3]:
Platform | Commission Fee (to Restaurants) | Delivery Fee (to Consumer) | Platform Promo Cut | Driver Payment Structure |
GrabFood | 15%–30% | Variable (avg. ~20 baht) | Yes, from commission | Delivery fee + platform incentives |
LINE MAN | 25%–30% | Variable | Yes, from commission | Delivery fee + possible incentives |
Foodpanda | 30%–35% | Variable | Yes, from commission | Delivery fee + possible incentives |
Robinhood | 0% | Competitive, variable | No commission from vendor | Delivery fee only |
The commission pressure on independent restaurants — particularly the 30–35% rates that Foodpanda charged before its exit — has been a recurring regulatory and industry discussion point in Thailand [4]. A government panel reviewed fee structures, and while formal caps have not been implemented, the debate influenced platform positioning strategies, notably Robinhood’s zero-commission model.
For restaurant operators assessing platform partnerships, the effective cost is not the headline commission rate alone. Promotional participation requirements, platform-mandated discounting, and the logistics of managing multiple platform integrations all affect the real economics of delivery channel participation in this food delivery market.
Consumer Behaviour and Generational Breakdown
Behavioural data across generational segments reveals distinct usage profiles with direct implications for platform strategy and F&B brand positioning:
Generation | Most Popular Apps | Usage Share (%) | Delivery Frequency per Week | Key Behavioural Traits |
Gen X | GrabFood, LINE MAN | 27% (lowest) | Lower than Gen Y/Z | Prefers convenience, orders less frequently, often compares prices/promotions, values reliability. |
Gen Y (Millennial) | GrabFood, LINE MAN | 40–58% (highest) | Moderate to high | Largest user group, uses multiple apps, compares deals, values variety and promotions. |
Gen Z | GrabFood, LINE MAN | 30% | Highest (multiple/week) | Smaller user base but highest order frequency, prioritizes convenience and app experience. |
Gen Y represents the largest share of active users at 40–58%, and their behaviour pattern — multi-platform comparison, promotion sensitivity, moderate-to-high order frequency — makes them the primary volume driver for both GrabFood and LINE MAN. Platform loyalty programmes and subscription models are largely designed around retaining this segment.
Gen Z represents 30% of users but the highest per-user order frequency, which means they generate disproportionate transaction volume relative to their share. Their platform selection is more experience-driven — app usability, speed, and integration with social content — which has direct implications for how platforms and restaurant brands approach digital-first marketing in this channel.
Gen X’s 27% share and lower order frequency makes them the least platform-dependent segment, but their higher average spend per order and preference for reliability over novelty makes them a commercially valuable retention target for platforms seeking to expand beyond convenience-driven usage patterns.
For brands entering or expanding in the delivery channel, consumer behaviour research (link: /services/qualitative-research/) that maps these generational patterns to specific category and cuisine preferences provides the segmentation foundation that aggregate market data cannot supply.
Food Delivery Industry Trends — What Shapes the Market Next
Food delivery industry trends in Thailand over the next two to three years are shaped primarily by the structural consequences of Foodpanda’s exit and the ongoing pressure on platform economics.
Platform Consolidation: The redistribution of Foodpanda’s 19% share is the most immediate competitive dynamic. GrabFood and LINE MAN have both moved to capture displaced restaurant partners and users. The consolidation reduces consumer choice pressure on the two leading platforms and may relieve some of the promotional intensity that characterised the four-platform competitive environment. For restaurant operators, fewer platforms means less negotiating leverage on commission rates.
Subscription Models: Both GrabFood and LINE MAN have developed subscription offerings that bundle delivery fee waivers with other platform benefits. These models create usage lock-in and allow platforms to shift the revenue model away from transaction-by-transaction fee dependence toward recurring subscription revenue — a more defensible position against future competitive entry.
Cloud Kitchens: Delivery-only kitchen operations continue expanding in Bangkok and secondary cities. For F&B brands, cloud kitchens reduce the capital requirement for delivery channel entry and allow faster geographic coverage without the fixed costs of full restaurant locations. Platform data on high-demand areas and cuisine gaps increasingly informs cloud kitchen location decisions.
Health-Conscious Ordering: Menu category data shows growth in health-oriented options — lower-calorie, protein-focused, and dietary-specific selections — particularly among Gen Y and Gen Z users. Platforms are expanding category filters and health-label features in response, creating placement opportunities for brands that can credibly occupy this positioning in a delivery context.
Research Applications for F&B Brands and Platform Operators
For F&B brands, the data above raises specific strategic questions that market intelligence can answer: Which platform delivers the highest conversion for a given category? How does Gen Z’s usage frequency translate into repeat purchase rates for new entrants? What drives restaurant selection in the consideration stage — platform recommendation, promotional ranking, or social proof signals?
For platform operators and investors, the post-Foodpanda landscape creates due diligence questions around the sustainability of commission models, the competitive moat of subscription programmes, and the realistic addressable market for further geographic expansion.
Iconic Research works with F&B brands and platform operators on:
Consumer behaviour research — generational usage mapping, brand perception studies, platform decision driver analysis
Consumer insights — category-level segmentation and positioning research for delivery-first product development
Market entry planning — competitive landscape assessment, channel strategy, and distribution partner evaluation for brands entering the delivery channel
Conclusion & Key Data Points
- Thailand’s food delivery market reached an estimated 100 billion baht by 2025, up from 35 billion baht in 2019
- GrabFood leads with 35% market share; LINE MAN holds 33%; Robinhood 13%
- Foodpanda exited in May 2025 — redistribution of its 19% share is the defining near-term competitive dynamic
- Commission structures range from 0% (Robinhood) to 30% (LINE MAN) for restaurant partners
- Gen Y represents the largest user segment (40–58%); Gen Z has the highest order frequency
- Platform consolidation, subscription models, and cloud kitchen expansion are the structural trends shaping the next phase
- Consumer behaviour research and market entry planning are the primary research applications for brands and investors assessing this sector
Planning a move into Thailand’s food delivery market? Talk to our research team — we work with F&B brands and platform operators on consumer research, market entry, and competitive positioning across Thailand and Southeast Asia.
Frequently Asked Questions
What is the most popular food delivery app in Thailand?
GrabFood leads with 35% market share, followed by LINE MAN at 33%. Robinhood holds 13% with its zero-commission model. Foodpanda exited the market in May 2025.
How big is the food delivery market in Thailand?
The market reached 68 billion baht in 2020 and an estimated 100 billion baht by 2025, up from 35 billion baht in 2019. Growth was driven by pandemic-related behavioural shifts and sustained digital adoption across urban and secondary city markets.
Which generation uses food delivery apps most in Thailand?
Millennials represent 40–58% of users and are the largest active segment. Gen Z represents 30% of users but has the highest order frequency, ordering multiple times per week. Gen X represents 27% and orders less frequently.
What commission fees do food delivery apps charge in Thailand?
Following Foodpanda's exit in May 2025, the major active platforms are GrabFood (15–30%) and LINE MAN (25–30%). Robinhood charges 0% commission to restaurant partners. Commission rates do not include promotional participation costs or platform-mandated discounting.
What's the future of Thailand's food delivery market?
Subscription models, cloud kitchen expansion, and health-oriented menu categories are the structural growth drivers for the active platforms over the next two to three years.
References
- Rakuten Insight. “New survey: Food Delivery Apps in Thailand.” https://insight.rakuten.com/food-delivery-apps-in-thailand/
- Heaven is Hua Hin. “New Thai Delivery Apps Offer Low-Fee Alternative to Big Tech.” https://huahin.locality.guide/2025/05/22/new-thai-delivery-apps-offer-low-fee-alternative-to-big-tech/
- Grab. “#AskGrab: Where does the merchant commission go?” https://www.grab.com/th/en/blog/askgrab-merchant-commission/
- Bangkok Post. “Panel mulls online food delivery fee revamp.” https://www.bangkokpost.com/business/general/2127895/panel-mulls-online-food-delivery-fee-revamp
- Statista. “Most popular food delivery apps in Thailand as of April 2023.” https://www.statista.com/statistics/1279851/thailand-most-used-food-delivery-apps/
If you wish to quote any information from this article, please kindly cite the source along with the link to the original article to respect copyright. |
Iconic Research Thailand Your trusted partner in market research and consulting across Thailand and Southeast Asia. Headquartered in Bangkok, we provide research-driven insights across the Philippines, Malaysia, Indonesia, Singapore, Laos, and Vietnam. We help businesses navigate Thailand's market complexities through consumer insights, market entry strategy, and trend foresight. Contact us if you have any queries! (+66)888 954 954 |
Contact us
We always looking for new and exciting opportunities. Let’s connect.
Related posts
 Growth Strategy: The Expansion Decisions That Need Evidence
Growth strategy is the set of decisions about where a company expands next. Only 25% of companies grow sustainably — the difference is evidence, not ambition.
9 min read Brand Strategy: The Decisions That Should Be Built on Evidence
Brand strategy is the set of decisions that determine how a brand competes. Those decisions only pay off when they’re built on consumer evidence — not a workshop.
11 min read Key Opinion Leader: What Thai Brands Should Research Before, During, and After a KOL Campaign
Platform metrics mislead brands choosing and measuring KOLs in Thailand. A research-first look at what to verify before, during, and after a campaign.
10 min read