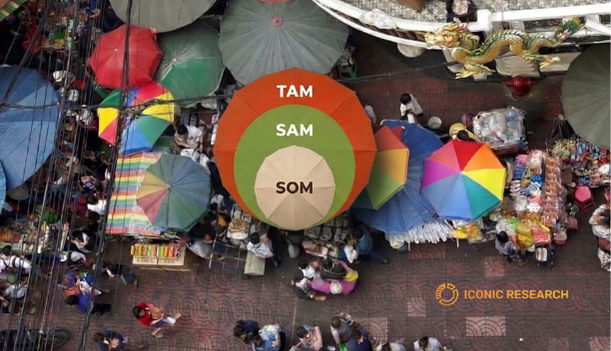
TAM SAM SOM is a three-layer market sizing framework used by founders, investors, and strategy teams to define the scale of a market opportunity before committing resources. TAM — Total Addressable Market — sets the theoretical ceiling for a category. SAM — Serviceable Addressable Market — narrows that figure to what a specific business model can realistically reach. SOM — Serviceable Obtainable Market — defines the share of SAM achievable within a defined time horizon, typically three to five years. Applied correctly, the framework separates genuine market opportunity from aspirational framing. Applied poorly, it produces large numbers that impress no one who looks closely.
Table of Contents
- What Is TAM SAM SOM?
- Top-Down vs Bottom-Up Market Sizing
- TAM SAM SOM Example — Applying the Framework to Thailand
- TAM SAM SOM Template — Building Your Market Sizing
- Market Sizing Challenges Specific to Thailand
- When Desk Research Ends and Primary Research Begins
- References
Before entering a new market, launching a product, or making an investment case, one question determines everything: is the opportunity actually large enough to justify the commitment? TAM SAM SOM is the framework that makes that question answerable — and applying it correctly to Thailand requires both the right methodology and an honest understanding of where Thailand’s data is reliable and where it is not. For businesses at the stage of assessing whether Thailand is worth entering, see our feasibility study service.
What Is TAM SAM SOM?
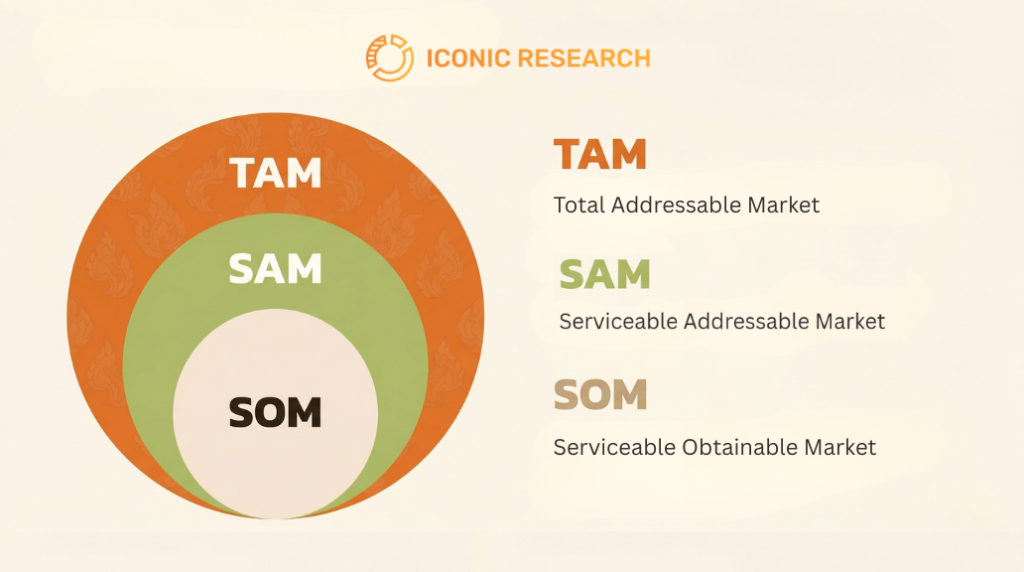
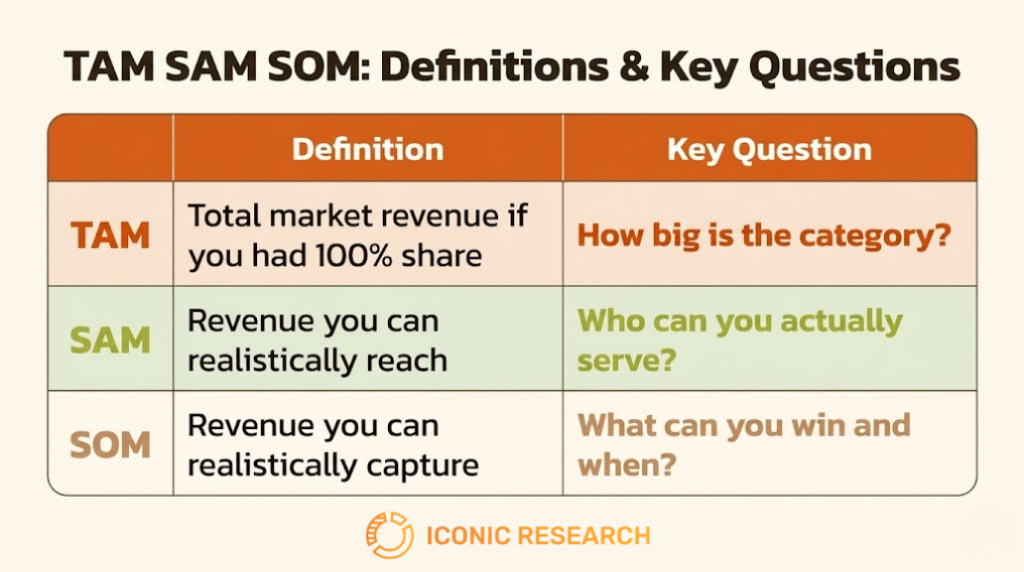
TAM — Total Addressable Market is the total revenue opportunity available if a product or service achieved 100% market share with zero constraints. It is the theoretical ceiling — useful for understanding the scale of a category, not as a realistic target.
SAM — Serviceable Addressable Market is the portion of TAM that a specific business model, geographic reach, and product offering can realistically serve. A company selling B2B SaaS to Bangkok enterprises has a different SAM than one selling to SMEs nationwide, even if their TAM is identical.
SOM — Serviceable Obtainable Market is the share of SAM a business can realistically capture within a defined time horizon. This is the number investors scrutinise most carefully — it requires defensible assumptions about competitive position, sales capacity, and penetration rate.
Those penetration assumptions depend on having a clearly defined target audience — the specific segment your product is actually for, validated through research rather than constructed from intuition.
Top-Down vs Bottom-Up Market Sizing
Top-Down Market Sizing
Top-down market sizing starts from a published total market figure and narrows it by applying segment filters — geography, customer type, product category — to arrive at SAM and SOM [1].
Thailand example: Thailand’s dietary supplement market was valued at approximately USD 2.41 billion in 2024 [1]. A European nutraceutical brand targeting urban health-conscious adults aged 25–45 in Bangkok would apply an income filter (upper-middle income households represent approximately 35% of Bangkok’s population), a category penetration filter (supplement purchasers among that segment), and a channel filter (pharmacy and online only, excluding modern trade). Each filter reduces the TAM to a SAM that reflects the brand’s actual distribution reach.
Strength: fast, requires limited primary research, useful for early feasibility checks. Weakness: depends on the quality of the starting data. Thailand’s published market figures are often outdated, Bangkok-skewed, or inconsistent across sources.
Bottom-Up Market Sizing
Bottom-up market sizing builds from unit economics upward: identify the target customer unit, estimate reachable units, multiply by revenue per unit [2].
Thailand example: Thailand has approximately 3.2 million SMEs [2]. A cloud software provider targeting Bangkok-based SMEs with 50–200 employees in the services sector would filter by location (Bangkok represents approximately 15% of registered SMEs), by employee band, and by sector. Average contract value: 180,000 baht per year. The bottom-up SAM calculation makes every assumption explicit and auditable.
Strength: forces explicit assumption-making, more defensible in investor and consulting contexts, surfaces data gaps before they become problems. Weakness: requires granular data on customer counts, conversion assumptions, and pricing — which in Thailand often requires primary research to validate.
Which to use: top-down for initial feasibility and investor framing. Bottom-up for operational planning and strategy validation. The strongest market sizing uses both and triangulates — if the two approaches produce significantly different numbers, that gap is where the assumptions need interrogating. Investors and consultants ask specifically which method was used and why.
TAM SAM SOM Example — Applying the Framework to Thailand
The following examples are illustrative. All figures are framed as estimates based on sourced data.
Example 1 — Consumer Product: Health Supplement Brand
TAM: Thailand’s dietary supplement market, approximately USD 2.41 billion (Grand View Research, 2024) [1].
SAM: Urban health-conscious consumers aged 25–45 in Bangkok who purchase premium imported supplements. Applying a Bangkok urban population filter (approximately 10.5 million), an upper-middle income filter (approximately 35%), and a supplement user penetration estimate (approximately 40% of that income segment) produces a SAM of roughly USD 590 million — approximately 24% of the total market.
SOM: A new brand with limited distribution (pharmacy and online only), no above-the-line media spend, and no Thai brand equity. A 2–3% penetration of SAM within three years produces a SOM of approximately USD 12–18 million. Whether that justifies the investment is a strategic question — but it is now an auditable one.
Example 2 — B2B Services: SaaS Company Entering Thailand
TAM: Thailand’s enterprise software market — sourced from a sector report with date stated.
SAM: Mid-size Thai and multinational companies (200+ employees) in Bangkok in financial services and retail — filtered using Department of Business Development registration data by sector and size.
SOM: A conservative 1–2% of SAM for a new entrant with no Thailand presence, justified by comparable regional market entry data.
The assumptions are the argument. Any investor reviewing a TAM SAM SOM will stress-test the assumptions, not the arithmetic. Sensitivity analysis separates a credible market sizing from a slide deck number.
TAM SAM SOM Template — Building Your Market Sizing
A market sizing template structures the calculation process and forces every assumption into the open. The following five-step framework applies to both top-down and bottom-up approaches.
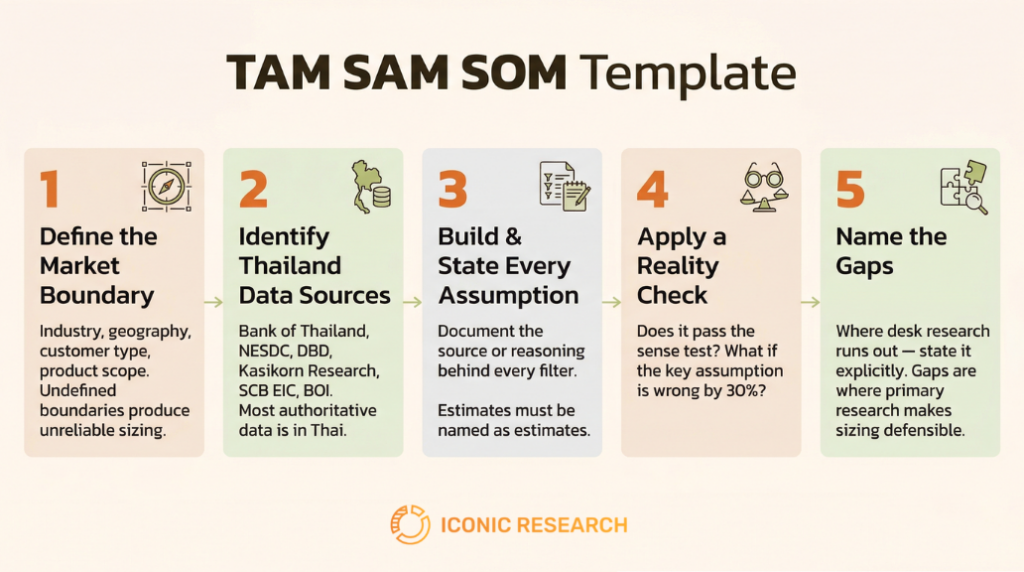
Step 1 — Define the market boundary. Before any calculation, state exactly what is and is not included: industry, geography (all Thailand, Bangkok only, urban Thailand), customer type (B2C or B2B, which segments), and product or service scope. Undefined boundaries produce unreliable sizing.
Step 2 — Identify Thailand data sources. Primary sources for this market sizing template: Bank of Thailand (payment and financial sector data), NESDC (GDP and sector data), Department of Business Development (company registrations by sector and size), Kasikorn Research Center and SCB Economic Intelligence Center (sector market reports, freely available), Thailand BOI (foreign investment data), and relevant industry associations. Note that most authoritative Thai data is published in Thai — a practical gap for international teams without local research support.
Step 3 — Build the calculation and state every assumption. Apply the chosen method — top-down or bottom-up — and document the source or reasoning for each filter. “Urban Bangkok represents approximately 15% of registered SMEs” is an assumption that needs a source. “Premium supplement users represent approximately 40% of upper-middle income consumers” needs either a source or an explicit acknowledgement that it is an estimate.
Step 4 — Apply a reality check. Three questions: Does this number pass the sense test against comparable markets? What happens to the SOM if the key penetration assumption is wrong by 30%? Does the figure align with what comparable market entrants have publicly reported?
Step 5 — Identify what desk research cannot answer. Every market sizing exercise reaches a point where published data runs out and assumptions become speculative. Naming those gaps explicitly — rather than filling them with guesses — is what makes a market sizing credible. These gaps are where primary research produces the data that makes the sizing defensible to investors and boards.
When desk research reaches its limit, primary data collection is the next step — our data collection guide for Thailand covers which methods apply to which segments.
Market Sizing Challenges Specific to Thailand
Data fragmentation and recency: Thailand’s market data is distributed across the Bank of Thailand, NESDC, multiple bank research arms, and industry bodies with inconsistent methodologies and publication schedules [3]. International databases often draw from the same underlying sources — consulting multiple databases does not provide independent validation. The provenance of source data matters as much as the number itself.
Bangkok is not Thailand: The majority of published market data reflects Bangkok or the greater metropolitan area. Thailand’s provincial markets — approximately 60% of the population — behave differently across income levels, distribution access, and purchase triggers [4]. Treating national figures as uniform produces SAM estimates that overstate accessible opportunity for most business models.
The informal economy: A significant portion of Thailand’s economic activity operates outside formal registration and published statistics. For FMCG, food service, and service categories targeting lower-income or rural segments, official market size figures systematically undercount the real landscape [3].
When Desk Research Ends and Primary Research Begins
Desk research is sufficient when a directional feasibility check is needed before committing budget, when TAM and SAM serve as investor context rather than operational inputs, or when prioritising between multiple markets on a comparable basis.
Primary research is necessary when the investment decision requires a defensible, auditable market size — not a directional estimate. It is also necessary when willingness-to-pay is unknown and critical to the SOM calculation, when the target segment is not well-represented in published data (informal sector, provincial markets), when competitive dynamics are opaque, or when Bangkok versus provincial split materially affects the business case and no reliable split data exists [5].
Frequently Asked Questions
What does TAM SAM SOM stand for?
Total Addressable Market, Serviceable Addressable Market, and Serviceable Obtainable Market. TAM is the full category ceiling. SAM is what a specific business model can realistically reach. SOM is the share achievable within a defined time horizon — typically three to five years.
What is the difference between TAM and SAM?
TAM sets the theoretical ceiling with no constraints. SAM applies realistic filters — which customers can the business model actually serve given distribution, pricing, and product scope? TAM frames the opportunity; SAM frames the realistic target.
How do I estimate market size for a new product in Thailand?
Define the market boundary precisely — customers, geography, product category. Choose top-down or bottom-up, or both. Source data from Bank of Thailand, NESDC, Kasikorn Research, and SCB EIC. State every assumption explicitly. For products with no comparable market, primary research is typically required to validate willingness-to-pay.
What are reliable data sources for market sizing in Thailand?
Bank of Thailand, NESDC, Department of Business Development, Kasikorn Research Center, SCB Economic Intelligence Center, Thailand BOI, and industry associations. Most authoritative data is published in Thai — accessing it requires Thai-language capability or a local research partner.
What is the difference between top-down and bottom-up market sizing?
Top-down starts from a published total figure and applies filters. Bottom-up starts from the customer unit — reachable customers multiplied by revenue per customer. Top-down suits early feasibility; bottom-up suits investment decisions. The strongest sizing uses both and triangulates.
References
[1] Grand View Research. “Thailand Dietary Supplements Market Size & Analysis.” 2024. https://www.grandviewresearch.com/industry-analysis/thailand-dietary-supplements-market-report
[2] Nation Thailand. “State agency seeks THB1-billion budget to boost SME competitiveness.” December 2024. https://www.nationthailand.com/blogs/business/trade/40044166
[3] Bank of Thailand. Statistics and economic data. https://www.bot.or.th/en/statistics.html
[4] NESDC. Thailand Economic and Social Data. https://www.nesdc.go.th/nesdb_en/main.php
[5] Iconic Research. Thailand Market Entry and Feasibility Services. https://iconicthai.com/insights/feasibility-study/
If you wish to quote any information from this article, please kindly cite the source along with the link to the original article to respect copyright. |
Iconic Research Thailand Your trusted partner in market research and consulting across Thailand and Southeast Asia. Headquartered in Bangkok, we provide research-driven insights across the Philippines, Malaysia, Indonesia, Singapore, Laos, and Vietnam. We help businesses navigate Thailand's market complexities through consumer insights, market entry strategy, and trend foresight. Contact us if you have any queries! (+66)888 954 954 |
Contact us
We always looking for new and exciting opportunities. Let’s connect.
Related posts
 Brand Strategy: The Decisions That Should Be Built on Evidence
Brand strategy is the set of decisions that determine how a brand competes. Those decisions only pay off when they’re built on consumer evidence — not a workshop.
11 min read Key Opinion Leader: What Thai Brands Should Research Before, During, and After a KOL Campaign
Platform metrics mislead brands choosing and measuring KOLs in Thailand. A research-first look at what to verify before, during, and after a campaign.
10 min read Customer Persona: Build One That Reflects Real Thai Consumers
Most Thai brands have customer personas built from assumptions. Research-backed personas reveal a different consumer — and drive different decisions.
9 min read